|
Histories |

|

|
|
|
Histories |
|
|
Histories
|
Histories |
|
|
|
|
Histories |
|
|
Security History records contain dated data such as price quotes, dividend and share distributions and financial data. Most History data will come from downloads and/or imports, and thus will not need to be manually entered. The exception would be non-actively traded securities and securities whose data for which downloadable data is not available. For these, data may be manually entered, or omitted altogether as discussed below.
The Price History table appears as follows. The records are automatically filtered on the selected Security Id record symbol when you tab into the price history records:
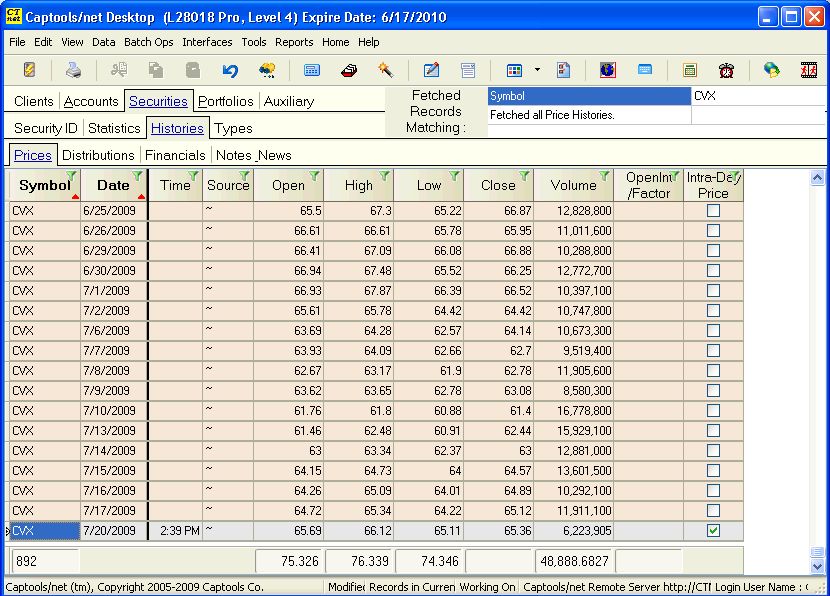
Data Fields - The Price records data fields are mostly self-evident, except that the "Source" is intended for a brief abbreviation indicating the data source. The Source will usually be filled in during the download process. The Time field is not currently used and is reserved for possible use in some future versions. An optionally viewable 8 byte field called "Close8" is contained in the record which provides 15 place precision in pricing vs. the 7 figure precision for the 4-byte "Close" field. Both fields are synchronously populated during imports and downloads and even manual data entry. Reports and computations will use the higher precision figure as long as it contains a non-null (blank) value.
Multi-Custodian Pricing - Higher levels of the software optionally support multi-custodian pricing, wherein when a price is fetched to value an account an attempt is made to use the price whose data "Source" matches the "Custodian" field in the account record. Multi-custodian pricing is activated on the "Config" tab of the Server Control Panel program (see the sub-topic Server Config. Options). If no price source match is found, the last price for a given date will be used.
Importance - Pricing is required to value account portfolios, however pricing for securities without download price sources may be entered directly into the portfolio valuations or the batch valuations, eliminating the need for manual price history data entry.
Bond Pricing - Bonds are often typically priced at a "par" of "100", with the security price factor set to "0.01" to obtain the correct valuation in the portfolios. If you see a portfolio appearing to be grossly overvalued, check to see if it contains bonds which have not been assigned the correct price factor. If so, correct the price factor in the security record and revalue the portfolio from the date at which the bond came into the portfolio. Another problem with bond pricing can arise from different custodians using a different price convention, e.g. one using a par of "1" and another of "100". In this case you will need to adopt one convention or the other throughout your accounts or use separate security identifiers for the bonds based upon where held. If you move accounts containing bonds from one custodian to another who use different pricing conventions you will need to re-normalize the old prices by highlighting the Maturity Price field of the bond in the security record and click on the "Data/Compute" command.
The Distributions History table contains the records of security dividends, capital gains distributions and share distributions or "splits". The records are automatically filtered on the selected Security Id record symbol when you tab into the distribution history records, and would appear as follows for a hypothetical security "XYZ", constructed to illustrate a variety of distributions:
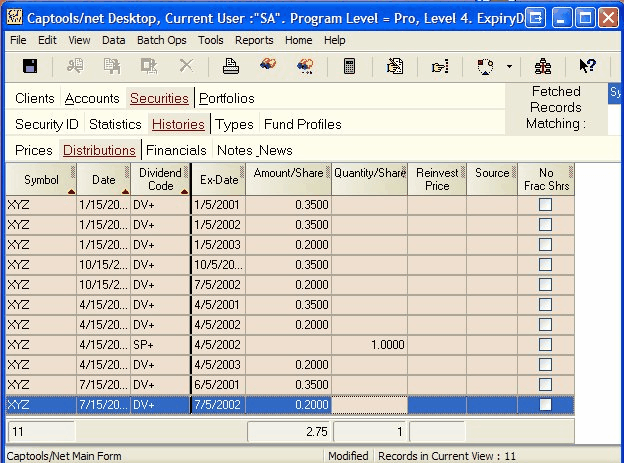
The Distribution History record fields operate as follows:
Date - This is the date that the transaction will appear in the portfolio of a shareholder of the subject security.
Dividend Code - This code indicates the type of distribution, using Captools/net transaction codes. These codes are define in the topic Transaction Codes.
Ex-Date - This is the date before which the security must be owned to be eligible for the distribution.
Amount/Share - The per share amount of a monetary distribution. E.g. if a stock pays a dividend of 75 cents per share you would enter "0.75". If the security is cash (symbol = "(CASH)") or is a cash equivalent money market fund, you need to enter the applicable annual percentage interest rate in this field, e.g. "5" for 5%,
Quantity/Share - The per share quantity of a share distribution. E.g. a quantity of "1" would be entered for a 2 for 1 split, a quantity of 0.5 for a 3 for 2 split.
Reinvest Price - This field must contain the applicable reinvestment price of the distribution if you are going to have the Distribution Generation function convert a monetary distribution into a reinvestment transaction as is often the case with mutual fund distributions.
Source - Short identifier indicating data download source.
No Frac. Shares - This field, if checked specifies that fractional shares are to be converted to cash during the Distribution Generation process.
Importance - Distribution History records are required for the "Tools/Distribution Generation" function and for factoring dividends and other distributions into Security Statistic record ROI's for individual securities. They are also used for accrual of pending dividend distributions in portfolio position records and for accrual of pending income on cash and cash equivalent securities. These records are not required for account portfolio management unless you plan to use the "Distribution Generation" function or employ the data from the Security Statistic records in your client reporting through use of a "Security Metrics" report (see below).
The "Tools/Distribution Generation" function (see Data Tools for more info) is used to generate portfolio distribution transactions. You would normally not need to perform this operation if you are importing custodian data which already contains distribution transactions. If you do not have custodian data to import, the "Tools/Distribution Generation" function can save you manual effort by generating these transactions for multiple portfolios.
The Security Statistic 13 week, 26 week, 12 month, etc. ROI's are computed based upon price history records and the distribution records. These ROI's indicate the market performance of the security independent of any particular account portfolio. These ROI's are used in "Security Metrics" reports. Performance of securities within a given account portfolio is computed based upon the transactions and valuations for that portfolio, and thus does not require these records.
Published Market Index ROI's - One difficulty with allowing Captools/net to compute ROI for market indices is that it is difficult to obtain the dividend information necessary to compute "Total Return", i.e. comprised of both price gains and dividends. However, if the publishers of market indices do periodically issue total return performance figures, you may enter these in the Distribution History records by using the code "ROI" for the "Dividend Code" and entering the return in the "Quantity/Share" field, expressed as a percentage increase or decrease since the prior reported figure. An example of this is shown at Benchmark Indices/Published ROI's.
The Financials History tables contain dated records containing key financial data on equity securities (common stocks). he records are automatically filtered on the selected Security Id record symbol when you tab into the financial history records, and would appear as follows:
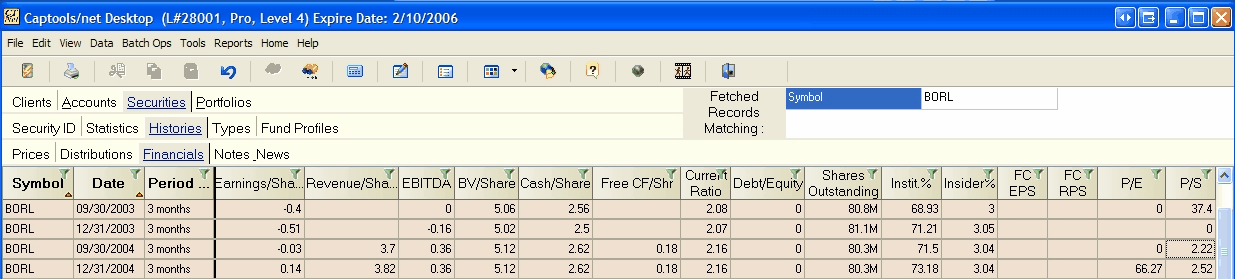
Financial History records fields operate as follows:
Date - This is the ending date for the company's financial reporting period.
Period Size - This indicates the time period covered by the period, typically, three months (quarter year).
Earnings/Share - Earnings per share usually as per "Generally Accepted Accounting Principles" (GAAP) in the U.S.
Revenue/Share - Revenue per share. Growth or decline of revenue per share is often a better indicator of company financial outlook than earnings per share which can be manipulated with write-offs. Some recent corporate scandals however (e.g. Enron, WorldCom), have involved falsified revenue.
EBITDA - This statistic ("Earnings Before Interest, Taxes, Depreciation, Amortization") is popularly reported for companies which do not have "real" earnings.
BV/Share - Book Value per share.
Cash/Share - The per share value of cash and marketable securities held by the company.
Free CF/share - Cash flow per share from company operations, less per share dividends and capital expenditures. This is often considered a better measure of company financial performance then earnings/share because it cannot be easily manipulated.
Current Ratio - Ratio of Cash and marketable securities plus short term receivables divided by short term liabilities (i.e. bills and debt due in next 12 months). A figure much less than one indicates that the company may have difficulty paying its bills and debt.
Debt/Equity - Ratio of corporate debt per share to book value per share. An acceptable figure depends upon the type of business, with companies such as electric utilities with highly predictable revenue and costs able to carry a higher figure, while companies with less stable revenues and expenses or subject to rapidly changing markets, such as high tech, requiring little or no debt.
Shares Outstanding - Shares of common stock in circulation. If number is followed by an "M" or "B" the number is respectively millions or billions.
Instit% - Percent of outstanding shares held by institutions, usually mutual funds. A high percentage can indicate stability, but a low percentage means that the stock will experience a substantial price increase if institutions become interested in it.
Insider% - Percent of outstanding shares held by corporate officers or directors or persons individually holding greater than 5% interest in the company. A very high figure, say greater than 30 to 40% often can indicate that frequent insider sales will depress share prices. A very low figure, say less than 1% indicates that even officers and directors do not believe enough in the company to own substantial shares in it.
FC EPS - Forecast earnings per share. This is usually an average of forecasts made by brokerage firm analysts.
FC RPS - Forecast revenue per share. This is usually an average of forecasts made by brokerage firm analysts.
P/E - Share Price to earnings ratio. An "acceptable" figure depends upon the revenue and earnings rate growth for the company and the economic environment such as interest rates.
P/S - Share Price to sales (revenue) ratio. An "acceptable" figure depends upon the profit margins. In some industries with traditions high profit margins such as tech and pharmaceuticals, P/S ratios of 3 to 6 are considered reasonable, while in low margin businesses such as some manufacturing and resources a P/S ratio of less than 1 may be seen.
Source - Short identifier indicating data download source.
Importance - The Financial History data is intended primarily as a tool to help Captools/net users search and filter equity fundamental data for purpose of evaluating common stock securities for purchase or sale. Some of the most recent of this data is replicated in the Security Statistics records which in turn can be reported to clients via a "Security Metrics" report. These records can be ignored or dispensed with if you will not need them for either of these purposes.
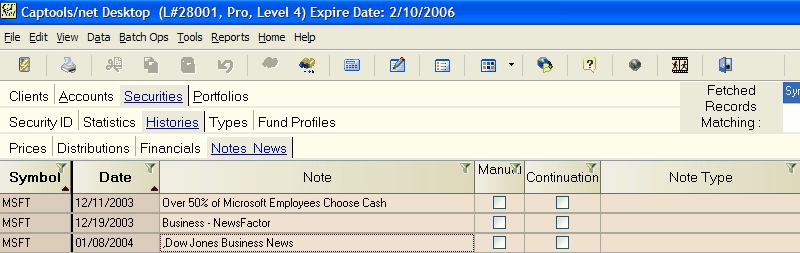
The Notes & News History records are intended to allow you to make a log of information concerning securities which you can later review when making an investment decision in those securities. The kind of information you may store in these records can be your own notes, web links to news headlines, or extracts from stories that you've copied and pasted. These records appear as follows:
The Notes and News data fields operate as follows:
Date - Date note entered or date of relevant news story.
Note - Contents of the note. In the grid view shown above the first few dozen characters of the note will be visible, so the subject should be located at the beginning. You my view the full note content by clicking on the "edit" button which appears on the right side of this field when you attempt to edit it (see example below). A note may contain up to 500 characters. If more characters are required, create a new note of the same date and check it as a "continuation". (note: the vertical parallel lines in the note field are the return/line feed character).
Manual - Optional check box which you may use to indicate that you manually entered the data to distinguish from downloaded data (future feature).
Continuation - Check this to indicate that the note is a continuation of the immediately prior note.
Note Type - This field is used to indicate how the note record is to function, with the following options:
Security Note - Default setting. This means the note is simply a reminder or such about the security.
Report Footnote - Checking this indicates that you intend the content of the note to be used in a footnote in reports activated to apply footnotes. This allows you to provide security-specific foot-noting in your client reports, thereby communicating with your clients regarding their specific security holdings.
Synthetic Index - Allows you to specify a synthetic index as describes at the topic Synthetic Indices.
Extended Description - Checking this indicates that the note is intended to be an extended security description.
Web Links - Checking this indicates that the note contains web links to websites relevant to the company.
Reprice - (reserved);
Transfer Agent - Note is indicating the securities transfer agent (may be used in reporting).
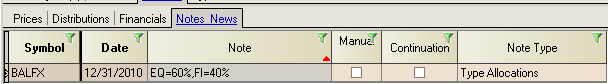
Type Allocations, Group Allocations, etc. - At level 3/higher these allow you specify security sub-allocations for reporting purposes, typically for mutual funds or securities which represent several market sectors. The notation to be used is as follows:
You must specify in the report special options that you want to use this function in your reports. (see Report Special Options).
Note Edit - To view the full contents of a note, click on the "Note" field until you see a small "edit button" on the right, e.g.:
Clicking on the button will give you full access to the note to view and edit:
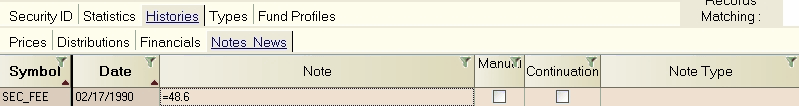
SEC FEE - One use for program computations is for computing the SEC fee on trades. The relevant rate is specified in the Security Note record using the symbol "SEC_FEE" as follows, with the applicable rate specified in the note field and the effective date in the date field:
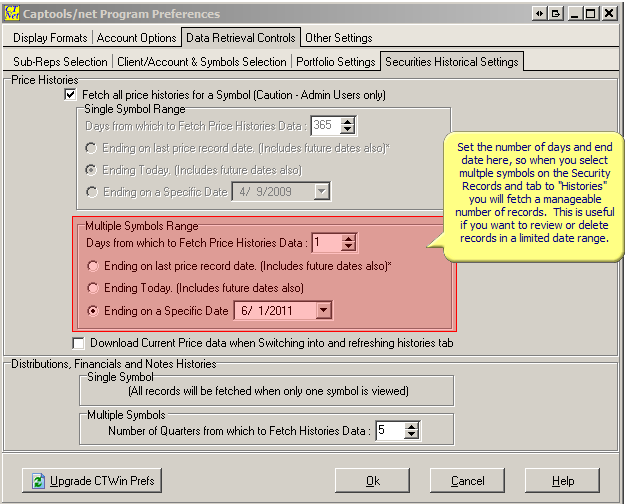
Accessing Multiple Symbols for Limited Dates
Sometimes it can be useful to access history records for multiple symbols for a limited date range, either to simply review the data or maybe to delete price history or other history data for a given date range. This can be accomplished by setting the Captools/net Program Preferences/Data Retrieval" controls as follows: