|
Performance Reports |

|

|
|
|
Performance Reports |
|
|
Performance Reports
|
Performance Reports |
|
|
|
|
Performance Reports |
|
|
As previously noted, Captools/net provides you with a wide variety of reports. Most of these reports can simply be selected, edited and run without any additional explanation. However, one category of reports which are deserving of additional discussion are the investment performance related reports. These are a category of reports that are often subject to close scrutiny by sophisticated clients and which also may be subject to professional standards, such as the performance presentation standards of the CFA Institute (formerly AIMR) organization.
Captools/net has been designed to allow you to deliver a wide variety of investment performance metrics on the accounts you manage and the securities contained therein. Each of Captools/nets performance reports contain many possible data fields. However page space limits the number of fields that can be displayed in any one report. Accordingly the examples shown here are merely representative some of the performance reports which can be generated. Additional information on Captools/net performance computations and methodologies are provided in the appendix topic Investment Performance (ROI).
This class of reports consists of ROI by Security portfolio reports, including security groupings by Class, Currency, Group, Long/Short, Style and Security Type and user-customized variations and cross-reference variations thereof. These reports generally show performance at the security detail level, e.g.:
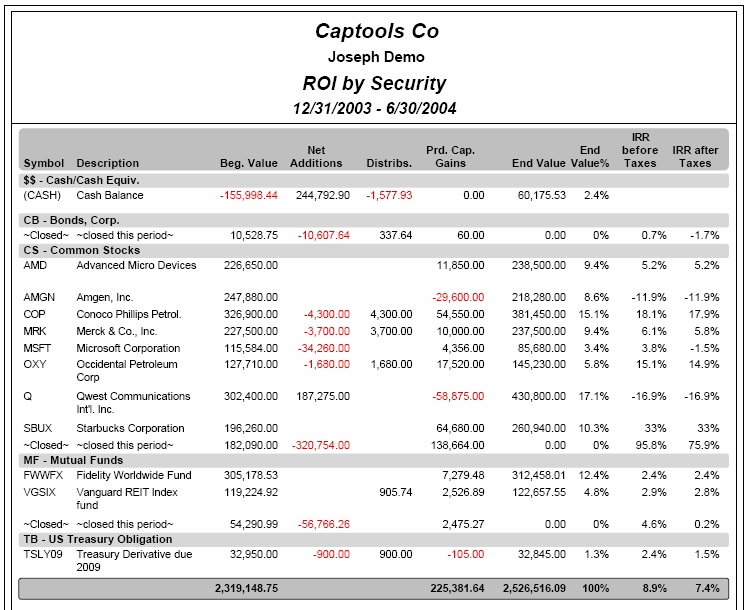
In this example, IRR (Internal Rate of Return), both before and after taxes is the performance metric shown. Report period beginning and ending values plus additions, distribution and gains fields are also provided to assist the reader in understanding the cash flows. Many other fields may be added to this report, subject to horizontal space limitations, which can be alleviated to a degree by using landscape page orientation and/or a smaller reporting font. This example also shows how the reporting of performance fields can be controlled by you at the record level, with a "blank" shown for the performance field in the "Cash" record (due to negative impact of fees). This example also shows closed positions consolidated into a single position using "Consolidate" for the Closed Positions option (see Report Special Options for option details).
Market Indices in User Text
While the Security Report contains fields for reporting the index symbol and return for the benchmark assigned to each security, you may wish to also report the one or more other benchmark returns for the applicable report period. This can be done using "placeholders" in the "User Text" area of the report as described in the topic Placeholders.
Multi-Period Security Performance Reports - The example report above is for a single period. However, for higher level Pro/Enterprise program versions it is possible to generate security performance reports which report for several periods. This is accomplished by using the Periodicity control on the report "Special Options" control page to specify more than one period. When this is done, the output appears similar to the above example, except that it is repeated until all the specified periods have been reported.
Portfolio Performance Reports
Portfolio performance reports are focused upon reporting the performance of one or more related accounts as a single entity as opposed to showing the performance at the security detail as did the security performance report described in the prior section (see Security Performance Reports). Because the security detail is omitted, there typically is space to include performance information for multiple time periods in portfolio performance reports. These time periods can be configured to have a common ending date (e.g. the end of the most recent reporting period) and different starting dates, or they may be configured to be sequential periods (e.g. for Year 1, Year 2, Year 3, and Current Period).
The type of time periods reported are controlled by the Periodicity control in the Report Special Options.
Performance to End Date Reports
This type of portfolio performance report is where all periods have a common ending date as shown in the example below. The end date is the same date as the End Date specified in the report run setup when a report is manually run, or is the computed end date when the report is run as a scheduled report (see Scheduled & Saved Reports).
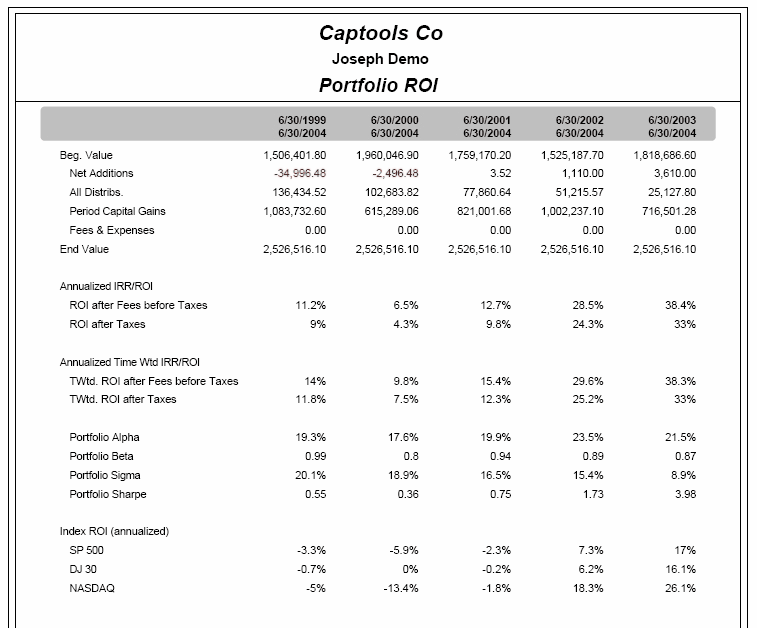
A common end date, as shown here, is the default way that periodicity is applied when generating portfolio performance reports. Thus if a periodicity of 5Y,4Y,3Y,2Y,*Y is specified, then four periods will be generated all with the same end date, but with the first one starting five years prior to the end date and the last starting at the end of the most recent prior year.
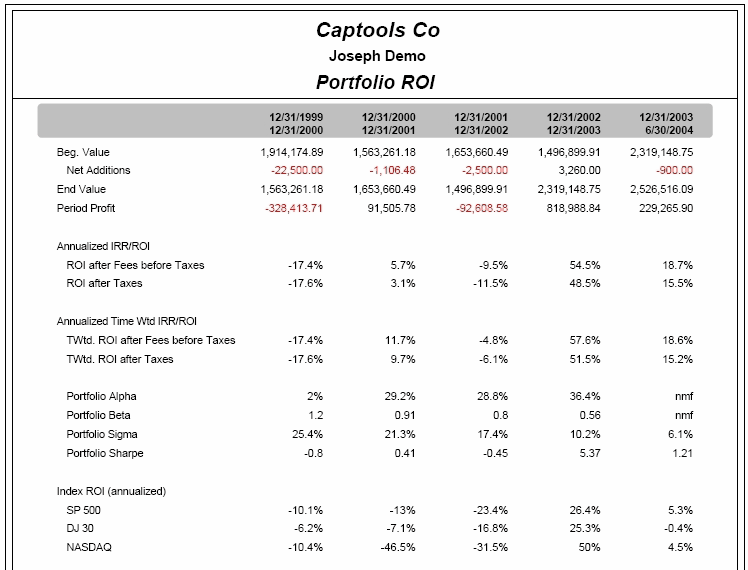
Serial Performance
Serial Performance reports are generated with "S" is included in the report periodicity specification, e.g. 1Y,1Y,1Y,1Y,*Y,S as was the case for the report example below. This type of report shows the performance for non-overlapping periods, unlike the "common end-date" type report in the prior example, thereby providing a different kind of view of the portfolio performance.
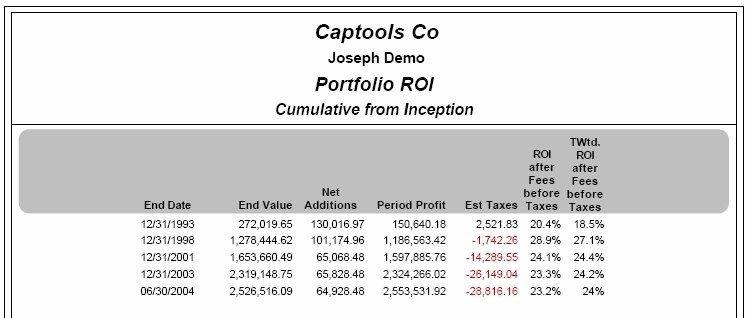
Cumulative Portfolio Performance
Higher level Pro and Enterprise versions of Captools/net offer a Cumulative Performance type of portfolio performance report. This is a version of the serial portfolio performance report, but without a "rotated" orientation typical of the other portfolio performance reports. It also reports annualized cumulative portfolio performance instead of the performance for a single period. Thus in the example below the performance reported on the final line is the performance for the portfolio from inception, while the prior periods are from inception to the specified date.
Performance Related Data Fields
The prior examples of performance reports show just a few of the available data fields for these reports. Typically the fields that you choose for these reports will depend upon your objective as to what information you wish to convey and how you want to have your information grouped in time (periodicity) or by security category. Space on the page will be the primary limitation on what and how many data fields that you use.
Some of the performance related fields available in Performance reports and their meaning are as follows. Please note that some of these fields are restricted to higher level versions of the program. Please also note that further discussion of ROI computation and reporting methodologies is provided in the appendix chapter Investment Performance (ROI):
ROI before commis. (rf_ROIbefCommis) - Internal rate of return on investment before commission costs (but after SEC trading fees).
ROI after commis. (rf_ROIaftCommisBefFees) - Internal rate of return on investment after commission costs, but before management fees
ROI after mgmt. fee (rf_ROIaftFeesBefTaxes) - Internal rate of return on investment after commission and management fee costs, but before estimated taxes.
ROI after taxes (rf_ROIaftTaxes) - Internal rate of return on investment after all costs, including estimated taxes on executed transactions.
ROI after Liquidation (rf_ROIaftLiquidation) - Internal rate of return on investment after all costs, including estimated taxes on executed transactions and the hypothetical cost of liquidating all current positions, assuming current tax rates and estimated trade commissions.
Annualized ROI (before commis./after commis./after mgmt fee, etc.) - These are the annualized rate versions of the above fields. If the AIMR-GIPS Annualization option is specified in the report special options, then it does not matter whether the Annualized or non-annualized version of these fields is selected, because annualization will be forced for periods greater than 365 days and non-annualization for periods less than 365 days. (See ROI Annualization for more details on annualization).
Time-Weighted ROI's - These fields, similar to those above, but prefixed by the "Twtd" notation report Time-weighted return on investment. Time-weighted ROI differs from IRR-ROI in that it removes the effect of additions and removals which occurred in the period being measured. Time-weighted ROI's are often preferred for reporting by investment professionals (and in fact are mandated by AIMR-GIPS for those required to adhere to their standards) because the amount of money available for a money manager to invest is usually out of their control, and thus the time-weighted measure more properly reflects their investment skill. (See Time & Dollar Weighted ROIs for more details on time weighted and IRR ROI's.)
Portfolio Alpha, Beta, R-sqrd - These fields report the alpha, beta and correlation measures resulting from comparing the portfolio performance statistics vs. that of the primary benchmark index for the portfolio, or to the Alpha/Beta benchmark symbol which can be specified in the report special options to override the account primary index. The primary index is designated in the master account record for the portfolio. A minimum of about six data points is required before any measure is reported. See the topic Alpha, Beta, Standard Deviation in the appendix for more information on these measures.
Portfolio Sigma - This reports the standard deviation measure resulting from statistical analysis of the portfolio performance data. This measure is not dependent upon the selection of a primary benchmark index. See the topic Alpha, Beta, Standard Deviation in the appendix for more information on this measure.
Portfolio Sharpe & Treynor Ratios - These fields report popular measures of performance, adjusted for risk. The Sharpe ratio adjusts for risk by subtracting the riskless return rate and then dividing by the standard deviation. This does not require a primary index. The Treynor ratio is similar, but divides by the beta, and therefore is subject to specification of a primary benchmark index.
Twtd. ROI After Cash Allocation - Higher level versions of the Pro and Enterprise versions offer three ROI reporting fields in which the ROI attributable to cash holdings are allocated to other holding classifications. These are provided primarily for users who want to compute returns by security category ("composite returns") for purpose of stating the investment firm's or money manager's management performance by category to prospective clients. Allocating the cash performance to other categories according to their weighting is in accordance with the prescription provided by the CFA Institute organization for their GIPS Performance Presentation Standards. The three fields provided, Twtd ROI before Fee/w. Cash Alloc., Twtd ROI before Fee/w. Cash Alloc., and Twtd ROI after Taxes/w. Cash Alloc., should provide the performance figures typically needed for composite performance reporting. One additional field, Percent of Cash Factor, is provided to enable you to see what percentage of the Cash performance is being allocated to the security being measured.
Pre-Margin ROI's - Higher level versions of the Pro and Enterprise versions offer a number of ROI reporting fields that compute performance before margin, i.e. what the performance would have been if the account had not taken advantage of margin borrowing to leverage performance. These ROI's are provided before and after fees, before taxes, and after taxes, and in annualized/non-annualized options, subject to the selection of the AIMR-GIPS annualization setting on the Report Special Options. Several additional fields, Average Leverage Factor, Twtd Leverage Factor, Margin Cost and Margin Cost%, are provided to assist your evaluation of the effect of margin on performance.
Market Benchmarks - Portfolio performance reports permit you to report the performance of up to nine benchmark indices to compare to the portfolio performance figures. The actual indices are specified in each account's records, and the symbol and description for the indices are substituted for the placeholder descriptions, Index0, Index1, etc. The topic Benchmark Indices provides more information about these indices, including how you can construct synthetic indices.
Blended Indices ROI - This portfolio performance report field permits you to report a custom index which can be a blend of several indices specifically customized to the account being reported. The blending percentages are specified in the Account note records as described in the topic Blended Indices.
Static Model Portfolio ROI - This portfolio performance report field, available in higher program versions, permits to report the performance of a model portfolio defined by the reported account's Investment Style in the Allocation records, where the allocation records in effect at the report ending date are used. Since these allocation records represent a single point in time, this is called a Static Model because it is assumed to represent the portfolio for the entire reporting period. See Model Portfolio Benchmarks for more detail on this topic.
Dynamic Model Portfolio ROI - This portfolio performance report field, available in higher program versions, performs the same function as the Static Model Portfolio ROI, except that if there are allocation records of more than one date for the portfolio's Investment Style then, it is assumed that the model changed during the report period and the model ROI is computed accordingly. See Model Portfolio Benchmarks for more detail on this topic.
Avg Security BM ROI - This field, available in higher program versions, reports the asset-weighted average of the performance of the benchmark index assigned to each portfolio asset in the security record of that asset. If no benchmark is specified for the security, then the account's primary index is assumed to be the relevant index. See Security Benchmark Indices for more details on this topic.
Index Statistics - In higher program versions all of the benchmark indices, blended indices, and model portfolio ROI's are accompanied by a data field to report the associated Alpha, Beta, Sigma, Correlation, Sharpe and Treynor statistics. In order to accommodate these on the report page with a minimum of space consumption, these are reported with several figures per column. You may control which statistics are displayed by editing the field name caption to specify which ones you want. The default caption is Statistics (a,b,c,s,sr,t). Modifying it to "Statistics (a,b,s)" would result in just the Alpha, Beta and Sigma statistics being reported.
Composite Style - In higher program versions, this field can be used in generating style based cross-reference performance composites by allowing the transaction level "Strategy" (Level 4) field and Acct.Id field to represent an investment style in lieu of the account "Investment Style" field. To use this, select this field as the grouping field for the report instead of "Investment Style". This will result in the Strategy field being used for the style, unless it is empty or deactivated, in which case the "Acct. Id" field is used unless it is empty or deactivated, in which case the Account level "Investment Style" field is used. The Values in the Strategy and Acct Id fields can be "translated" to a more meaningful strategy label by specifying the translation in the "Misc Specs" in "Other Options" using the notation "01=Growth,02=Value, etc".
Profit and Profit Percent (Caution)
These fields are available in all performance reports, with before management fee profit and profit percent available in higher program versions in the portfolio performance type reports. However, if you intend to use Profit Percent in your reports you need to understand the limitations of this performance measure. First of all, performance percent does not take into account the time required to achieve a performance. Thus, if you have a report showing the profit percent of various holdings over a five years time span, and one security was held for a year and advanced 10% and another was held for the full five years and advanced 10%, both would be reported with the same percentage. In contrast, if measured in terms of ROI, the first security would be reported with five times better performance.
Profit Percent Mathematical Issues - One other important difficulty in using profit percent as a performance metric is properly and consistently defining the correct denominator to use in computing the percentage. In particular, one is confronted with the dilemma of whether it is more proper to use gross investment or net investment as the denominator, and if the latter is used how to define net investment. If gross investment is used the denominator can possibly be overstated for a given security if money cycles into and out of that security several times during the relevant reporting period. If net investment is used, meaning money added less money removed, the denominator can actually become zero or negative, creating another problem. Captools/net deals with these math issues by using gross investment for the profit percent denominator at the account level and using net investment at the detail and subtotal level excepting where the denominator becomes unreasonably small or negative, in which case the gross figure is used. As a consequence of bowing to these mathematical necessities, however, "consistency" is sacrificed, so if that is important to you we would advise caution in use of the profit percent metric.